📊 Indices Market Tracker
Understanding the Indian stock market requires more than just watching one index. While many investors focus only on the benchmark, the real story of market strength, risk, and opportunity lies across different market-cap segments.
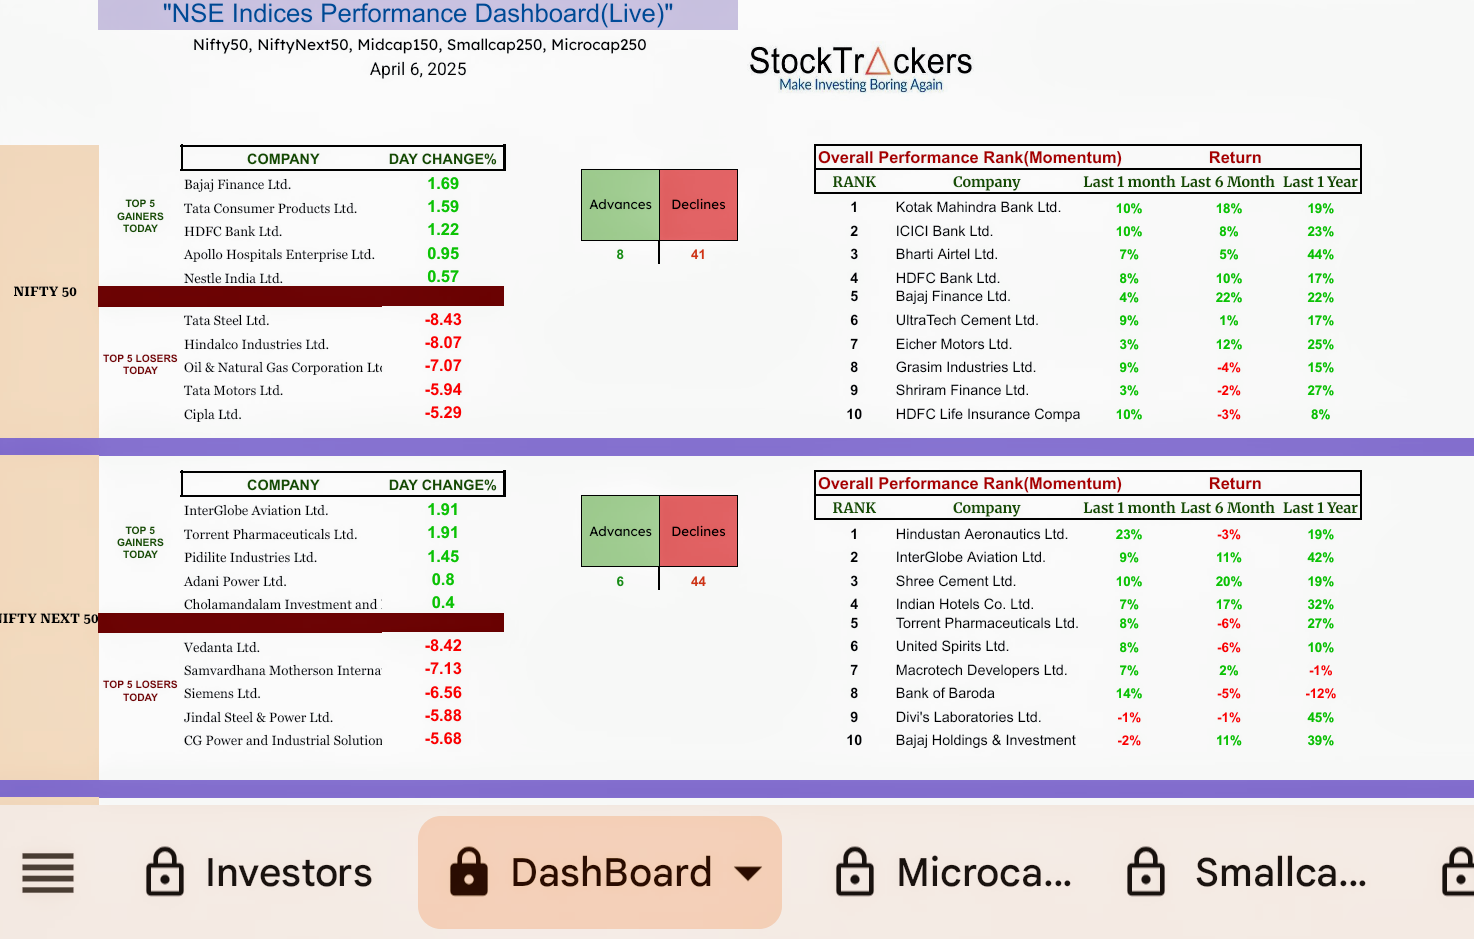
The StockTrackers Indices Tracker brings together major Indian equity indices into a single, easy-to-use data sheet, allowing investors to monitor market movements across large-cap, mid-cap, small-cap, and micro-cap companies in one place.
This tool is designed to help investors quickly identify where capital is flowing, which segments are underperforming, and where potential investment opportunities may be emerging.
📈 What This Tracker Covers
The tracker includes five major indices that collectively represent the broad Indian equity market:
🟢 Nifty 50
The benchmark index of the Indian stock market, consisting of 50 large and well-established companies. These are typically stable, liquid, and widely followed by institutional investors.
🔵 Nifty Next 50
Represents the next 50 companies after the Nifty 50. Many companies in this index are potential future large-cap leaders and often offer higher growth potential compared to the benchmark.
🟡 Nifty Midcap 150
Tracks mid-sized companies that are typically in the growth stage. These companies often provide strong expansion opportunities but may also experience higher volatility.
🟠 Nifty Smallcap 250
Represents smaller companies that can deliver high growth during strong market cycles. Small caps often outperform during bullish phases but can also experience deeper corrections.
🔴 Nifty Microcap 250
Covers the smaller and lesser-followed companies in the market. This segment is typically more volatile but can occasionally reveal hidden opportunities when strong companies are temporarily undervalued.
🔎 Why This Tracker Is Useful
Most investors analyze stocks individually, which can make it difficult to understand broader market trends. By viewing all major indices together, investors can:
• Identify which market segment is leading or lagging • Spot market rotation between large, mid, and small caps • Detect oversold or beaten-down segments during corrections • Understand overall market breadth and sentiment
It is very rare to find all these indices presented together in a single, easy-to-access view, making this tracker a valuable tool for both new and experienced investors.
💡 How Investors Can Use It
Investors can use this tracker to:
• Monitor overall market structure • Identify sectors or segments under pressure • Find potential opportunities when strong companies trade at discounted prices • Track changes in market momentum across capitalization segments
By combining index-level insights with individual stock research, investors can make more informed decisions and avoid relying only on headline market movements.
⚠️ Disclaimer: This tracker is intended for educational and research purposes only. It does not constitute investment advice or recommendations.
🔗 Explore more market tools: stocktrackers.in